 |
Matthew's Portfolio
|


|
|
Matthew's Portfolio
|
|
Once all the tasks and drivers were written, combining each function into a complete software program was the next step.
This included using a scheduler to run the tasks in a specific order, implementing a method for sharing data and variables between tasks, and saving data for post-processing and plotting.
To facilitate the culmination of tasks and shared variables, a task diagram was created in order to organize the program flow, as seen in Figure 14.
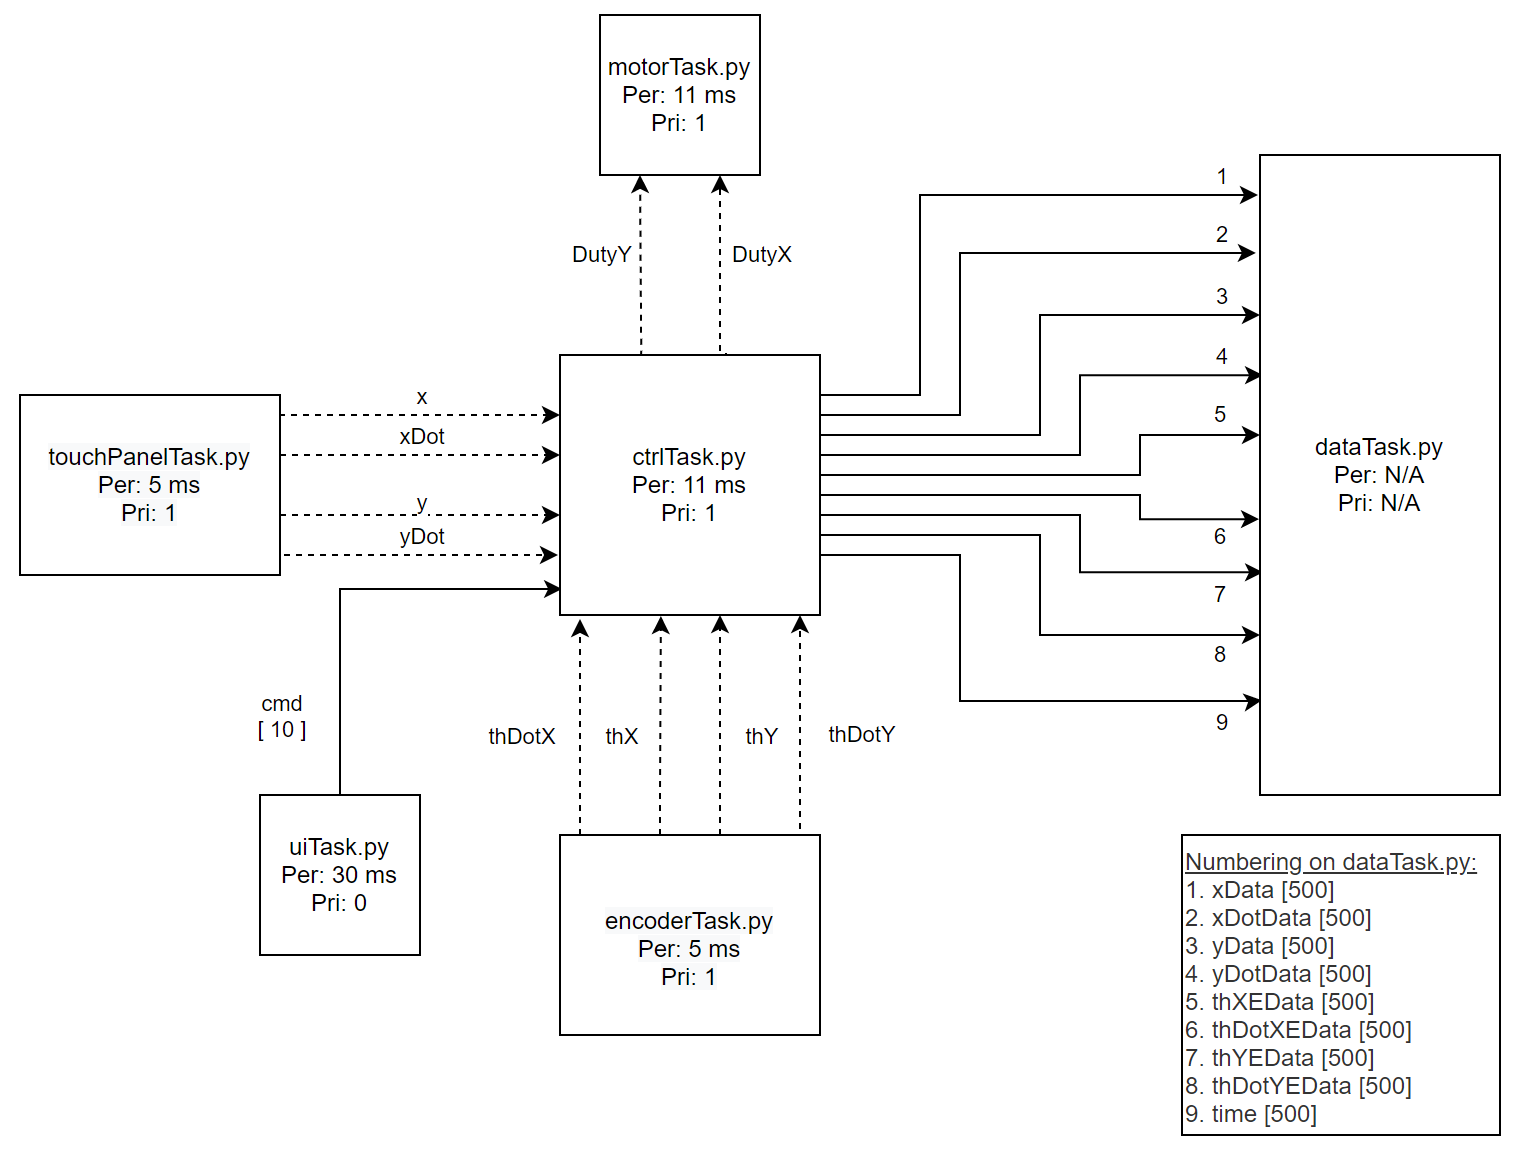
The following sections will explore each topic in greater depth.
To facilitate multitasking between scripts, a priority-driven scheduler was utilized. This scheduler was provided to the students from the instructors, but allowed for tasks to be added task list, where they were run at specified intervals to properly implement the controller. The scheduler ran tasks according to their priority: a higher priority meant that if two tasks were trying to run at the same time, the scheduler would run the higher priority task first. For this project, all of the tasks and controllers had an equal priority of 1, and the original data collection task had a priority of 0. When specifying the frequency to run the tasks, it was important to keep in mind how long the needed to run for, as trying to run the tasks faster than they can complete is not practical and leads to slowing the program down or running future tasks late.
Since timing was crucial, each task was optimized to run in the least amount of time as possible. This required cutting down code, eliminating print statements, reducing the number of stored variables, and many more techniques to save time and memory.
For detailed file documentation, see the link below:
Throughout the program, several variables had to be shared between tasks in order to implement the full-state feedback control algorithm. These included the position/velocity of the ball as well as the platform angle/angular velocity. From these, the duty cycle was computed and shared to the motor task to drive the motors.
To facilitate the shared variables, a file was provided in order to host the shared variables and shared queues. For the shared variables, any task with access to the task-sharing file could put() measured values to the variable, and then other tasks can get() to read those values. Similar structures were used for the queues, where a first-in-first-out system was used. The queues consisted of duplicates of the data, which would be saved in the largest queue possible to allow for plotting the measured values after the script was run.
To host all the shared variable declarations in one location, shares.py was created.
For detailed file documentation, see the links below:
Originally, a data collection task was ran in the scheduler with a low priority, however, it was found that it never had enough time to get data from the shared queues and send it through serial to the front end. Similarly, it didn't have enough time to 'batch' up shared data to send in one go at the end of the program.
Because of these timing issues, the data collection was reformatted to continuously save data to shares.py, and then when the user stops the program with Ctrl-C, the data is sent through serial. This eliminates the worry for speeding up the program, as speed is less of a consideration once the program finishes. Due to memory issues on the board, only a few variables could be storing data each run. For a given run, the position/velocity of the ball and angle/angular velocity of the platform in one direction, as well as the time, could be saved and plotted in the front end.
For detailed file documentation, see the link below:
The PC Frontend facilitated the collection of data streamed through the serial port, writing to a CSV, and then plotting. An automated plotting function was created within the front end to read the columns of the CSV and display 4 subplots. These were the ball's position/velocity and platform's angle/angular velocity for a given motor. This file was then saved as a png for inspection and analysis.
For detailed file documentation, see the link below:
Continue to the next section here: Testing and Tuning: Balancing the Ball