 |
Matthew's Portfolio
|


|
|
Matthew's Portfolio
|
|
Code Documentation:
This lab centered around measuring the time constant of the B1 "USER Button" on the Nucleo board. In almost all Mechatronics applications, it is critical to be aware of how certain components react. When the button is pressed, the button circuit is shorted, and the voltage quickly (typically modeled as instantaneously) drops to zero. However, upon release the button is subject to a first-order RC circuit. Thus, in order for us to fully understand how a full system that includes the button will function, we want to measure the time response for the button release phase.
When the user presses the 'g' key on their computer keyboard, a command will be sent over serial to the Nucleo to begin taking data. Next, the user is instructed to press and release the blue USER button. During this state, data is constantly being acquired through an ADC (connected to the button through Pin PA0 and a jumper wire to PC13, the actual button pin). The ADC takes data for a short period of time that is longer than the step response of the button release. When it is determined that the difference between the initial voltage (approximately zero) and the final voltage for a given data set is close to that of a 3.3 V increase, the Nucleo recognizes that it can stop collecting data and move on to processing./n/n
First, voltage data points (saved as numerical values between 0 and 4095) will be sent back through serial to the computer. Next, a plot of voltage versus time on semi-log axes is shown, and the user must specify an appropriate range of data to fit a linear trendline to. From this trendline, the time constant can be determined as the inverse of the slope. Finally, the experimentally determined time constant was compared to the theoretical value. From analyzing the circuit, the time constant is equal to RC, where R = 4.7kOhm and C = 100nF (see Nucleo technical specs. online).
Figure 1 below is a plot of the time response of the voltage within the circuit. This is plotted with -ln(Vdd-Vc) where Vdd is the maximum voltage (3.3V) and Vc is the current voltage of the system.
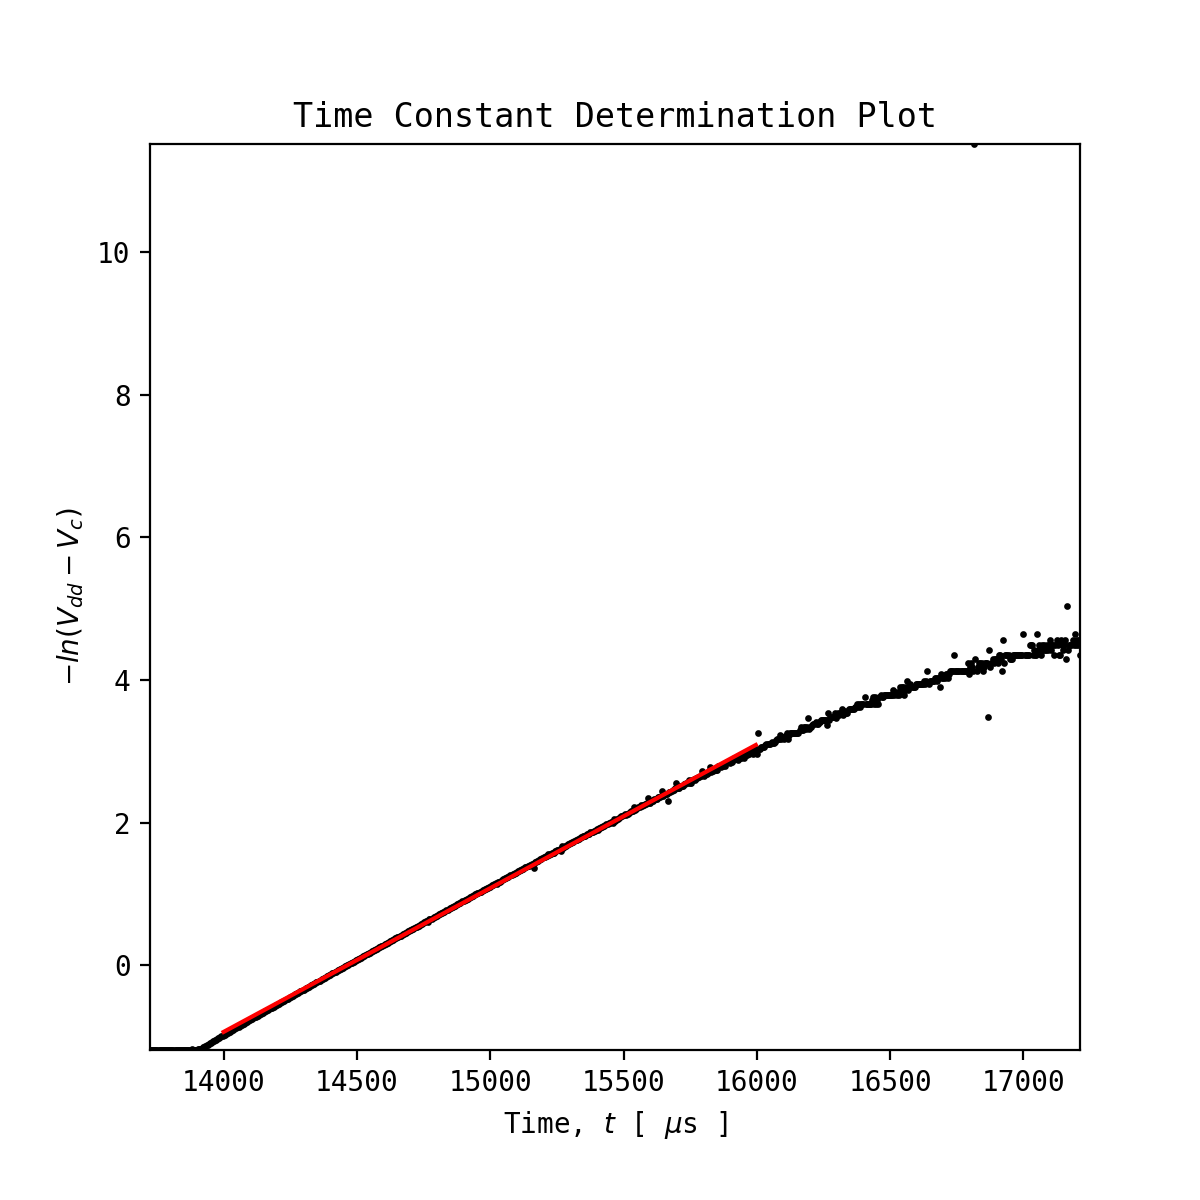
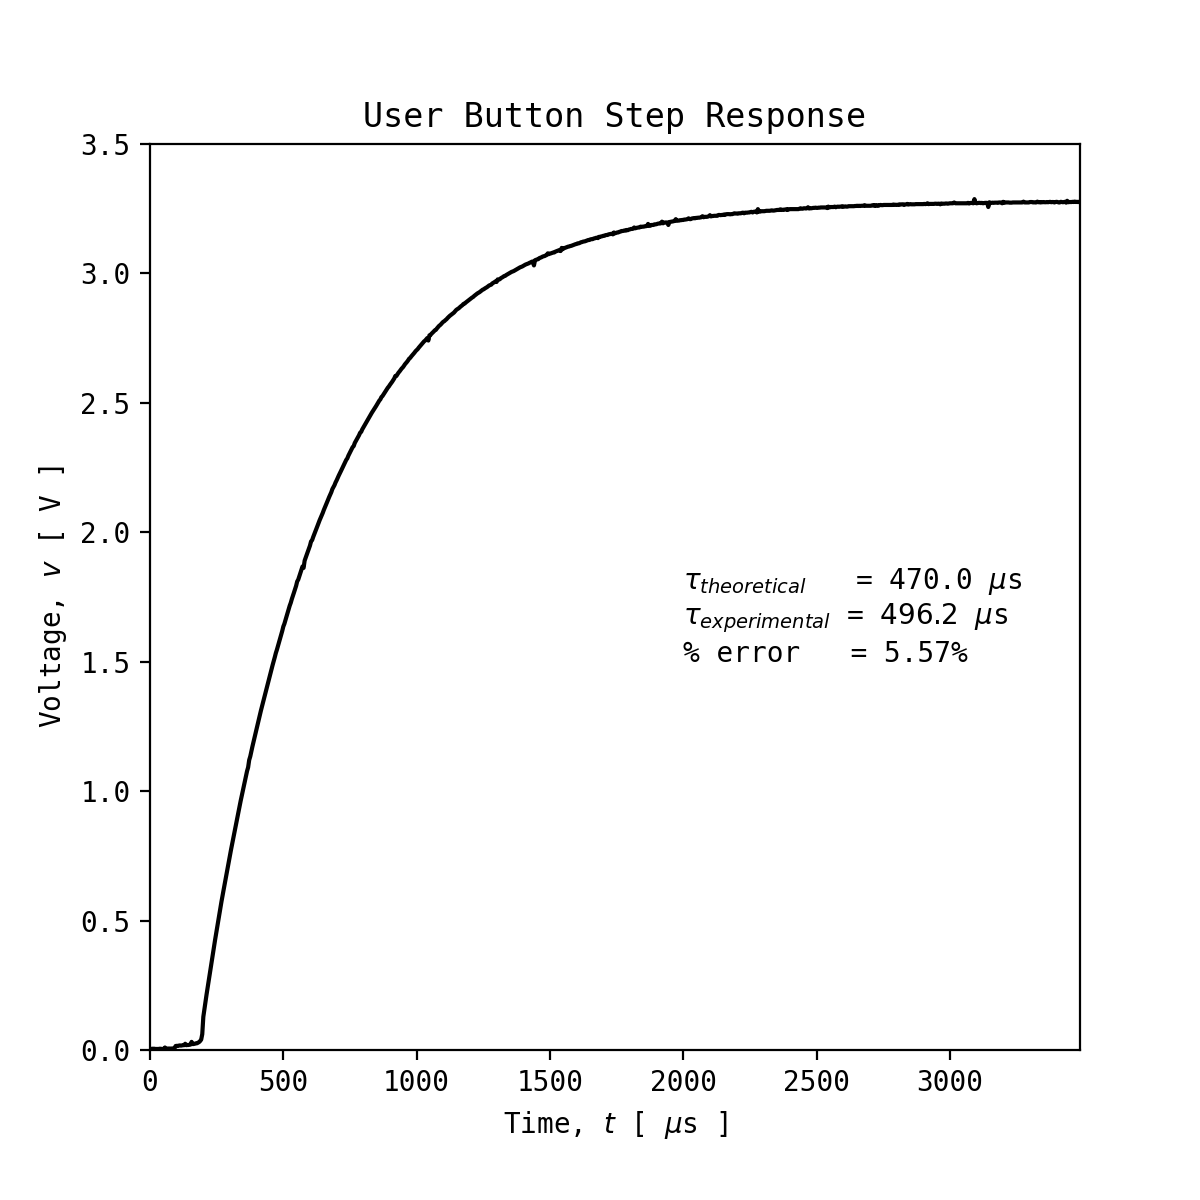
As can be seen on the plot, the red line has a range specified by the user for the data that has a somewhat linear correlation. This information is then taken and shown in Figure 2, with details such as the percent error as compared to the theoretical value also being included on the plot for convenience.
To see the .csv files generated, see the following links below:
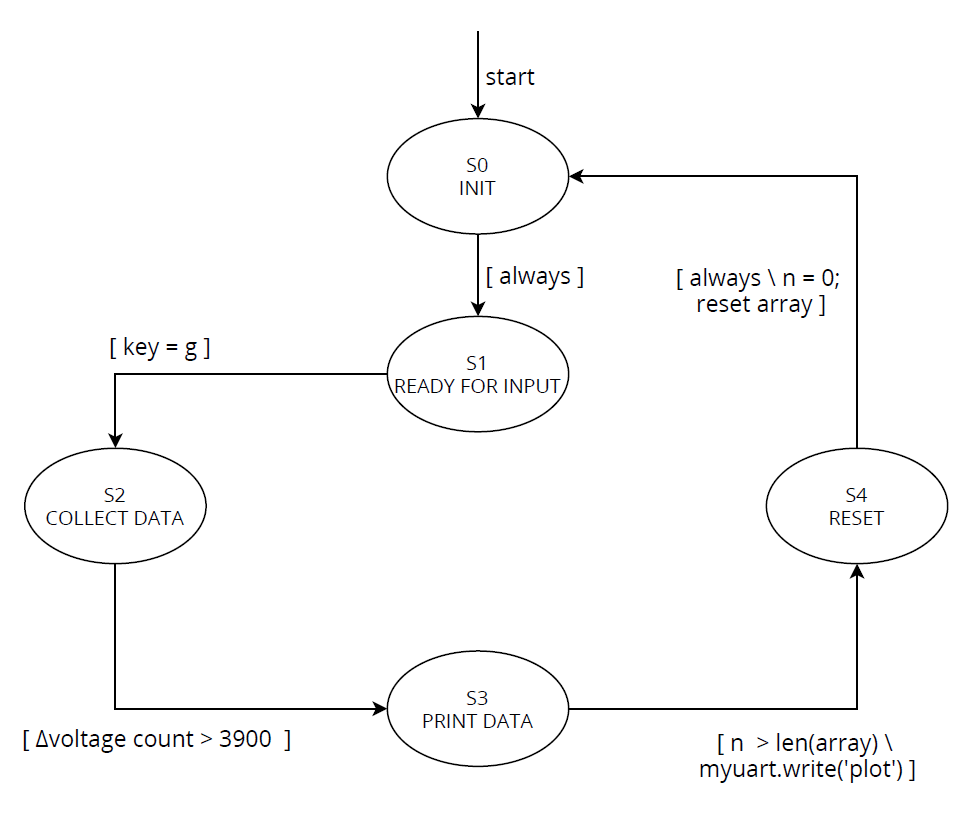
In addition to the plots generated during program operation, a state transition diagram developed for the UI task running on the Nucleo has been included below for refrence.
And lastly, see the YouTube video below for a demostration of program operation.
Click here for the next lab, 405 Lab 0x04: Hot or Not?.