 |
Matthew's Portfolio
|


|
|
Matthew's Portfolio
|
|
Code Documentation:
In Lab0x04 of ME 405, the final lab before focusing our attention fully on the term project, we were tasked with interacting with a sensor using I2C (typically pronounced either as "I-squared-C" or "I-two-C") communication. I2C uses two wires, a clock line and a data line to send and recieve data between two or more devices. Although we only used one sensor and one master device, I2C is ideal for using multiple devices, as the one Nucleo would still be the only master device needed.
As is often done for object-oriented programming, a driver class for interfacing with an MCP9808 temperature sensor was written for this lab. The methods of this class included:
run(): The main run method implementing a state machine,check(): A method for validating a proper connection between the board and the sensor,celsius(): Get the current temperature in degrees celsius,fahrenheit(): Get the current temperature in degrees fahrenheit,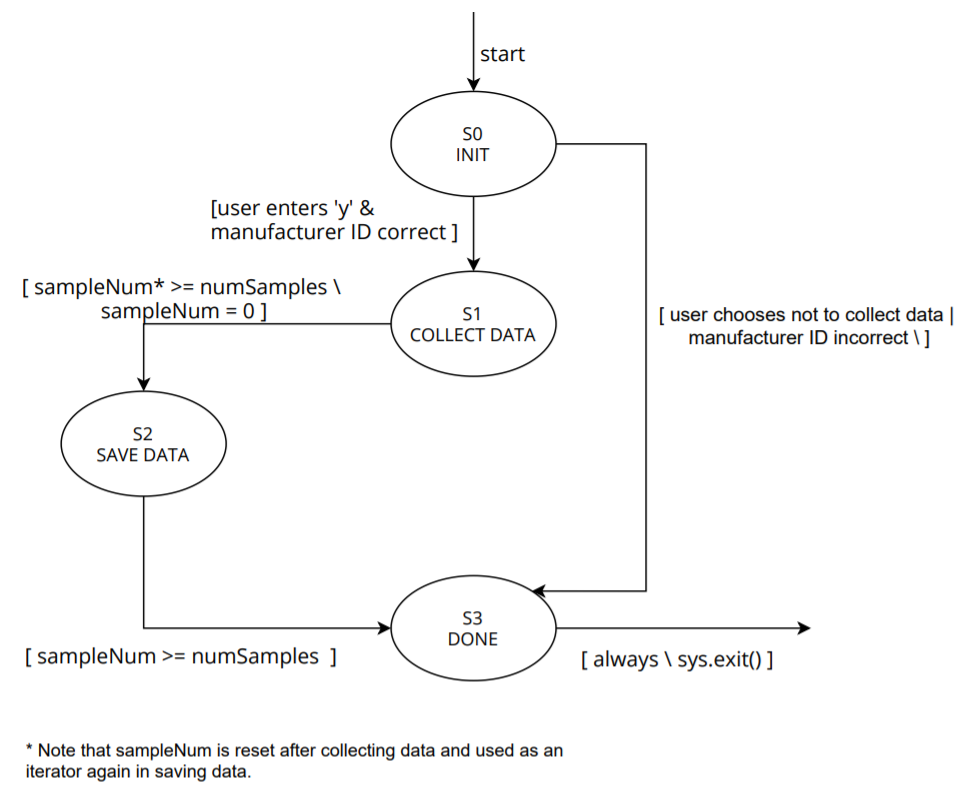
The overall goal for this lab was to collect at least eight hours of data, at a rate of one measurement every 60 seconds. To make the program more flexible, we incorporated a few user inputs at the beginning of script execution. These included:
Sampling rate (in seconds)
From these input values, the script determines what size arrays must be preallocated, and data collection begins. The plots below in Figures 4.1 and 4.2 show the results of two data collection sessions, one from each member of our group. Note that as a general comparision, data was also collected directly from the Nucleo MCU. This comparision gave proof that using the MCU core temperature (for the Nucleo board) is not an accurate measurement of the true ambient temperature. For both plots shown, the sensor data is much less scattered, and significantly lower in magnitude, as it is not affected by the extraneous effects of heat generated by the Nucleo from processing.
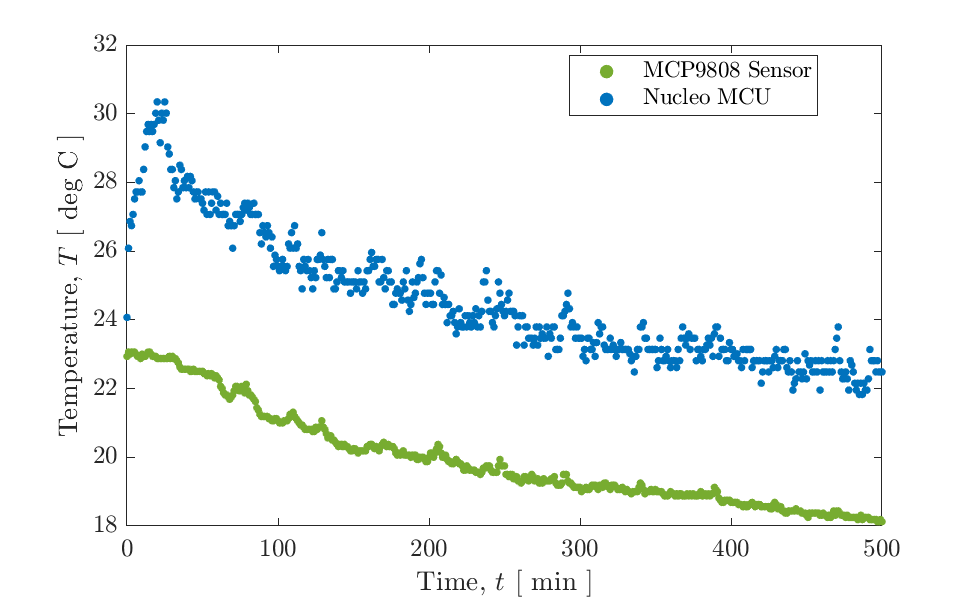
For context, and to understand the trends seen in Figure 4.1, the data above was collected with the temperature sensor sitting on an upstairs bedroom desk. Furthermore, data collection began at approximately 10 PM, and went for 500 minutes (slighlty more than 8 hours), and the window to this bedroom was open overnight. Therefore, the temperature steadily decreased through the night, with data collection ending before sunrise (where we would likely have seen an uptick) in temperature.

When analyzing the data shown in Figure 4.2, it's important to note the scenario. The nucleo was placed under the user's bed at approximately 1 AM (to prevent the light from disrupting the room) and the user went to bed about an hour after data collection began. The window was open for the first hour or so, and then shut when the user went to bed. The temperature most likely increased from there and reached steady state due to the heat from the user/computer counteracting the potentially decreasing temperature in the room as the night progressed. The test was ran for 8 hours (481 data points) and finished around 9 AM, where it can be seen that the temperature rose while the room heated from the sun. The dip around 450 minutes was when the user awoke and left the bed, providing less heat to the sensor.
Click here for the next lab, 405 Lab 0xFF: Final Project.